Tableau has been one of the most popular data visualization and analytics tools among the business users in the last decade. With the new features it is even simpler to see and understand data. It is evident that Tableau is made with the intention of appealing to everyone, even those with very limited technical know-how.
As always, the new version of Tableau is also packed with a punch. There are over 25 new features over the Desktop, Online, Prep and Mobile versions of the tool. Here are a few of them, that would significantly change the way you use this incredible platform.
I have been using this tool since the release on 6th May 2020. After a week of using it, I am convinced that the changes are significant and extremely useful. This new version seems a lot smoother (yes, that is the feeling you get when you use it), even compared to 2020.1, which was released last quarter. I will be focussing on some of the changes in the first blog, that would give you an overview and help you get started with this.
1. Relationships
As a trainer on Data Analytics for the last three years, I have experienced one struggle. It is about explaining the concepts of ‘Joins’ to business users. They find it confusing to know when to use ‘left join’ and when to use ‘full join’. (IT users and students had very limited issues since they have learned these concepts). Challenges like duplicate / repeating records in one of the tables (one to many mapping) is definitely hard to tackle unless you master the concepts and other techniques. However, in Tableau 2020.2, it uses ‘Relationships’ which is a much simpler and easier concept to understand, and Tableau does the heavy lifting if you are unsure
In this version, you can create logical relationship with data, visually. Relationship creates aggregations when you build the visualizations, rather than joining them in the database. This means that you can forget worrying about having to keep the data in the same level of details and the complications that would arise if it is not. For those who are familiar with the tool, the visual difference itself is quite significant. As soon as you drag and drop the second and subsequent tables, a relationship line (‘Noodle’ is what Tableau named these lines) appears and makes it easy to define the connection.
Once you add the table, a pop-up box suggests the best connection, where you can define further details (Cardinality and Referential Integrity) if needed. You can also view each of the tables independently even after defining the relationship. All you need to do, is just click on the table. You can also use the existing concepts of Union and Joins as well. Below is a simple example using Sample Superstore data.
2. Metrics
Metrics is a concept that would appeal to the higher management and executives. This is an option where you can track all metrices of your interest in one place, despite of it being included in multiple Tableau workbooks. Instead of creating a ‘Master Workbook’ with all the metrics, which involved development and maintenance effort, we can now do it with a simple click. It will add the Metrics or KPIs to the main Project folder itself. In addition, you can also see the trend of that particular metric over the period when the data refreshes.
In the example below, I have one Project in Tableau Online, which has got multiple dashboards catering to different business areas. I am adding two metrics: the number of male employees in the organization, and the YTD Sales. Since the data is not refreshed, the timeline will be empty. Just check out how easy it is to add the Metrics to monitor it continuously and effectively.
3. Set Controls and Set Action Updates
While this might be described as a new feature, it, in fact, opens a whole new set of opportunities to interact with your visualizations. If I try to describe set Controls in Tableau 2020.2, it can be simplified as an option in which we can include or exclude elements in a set in a simple drop-down (similar to ‘Filters’). The addition or deletion or new values in a set can significantly change the way we see the data.
This means that the end user can perform a variety of analysis in the front end. Check out the video below.
Set actions also has got two new selection modes as well in the new version. Tableau 2020.2. Instead of only assigning the set values, Set Action can now add or remove values incrementally, by interacting with the marks.
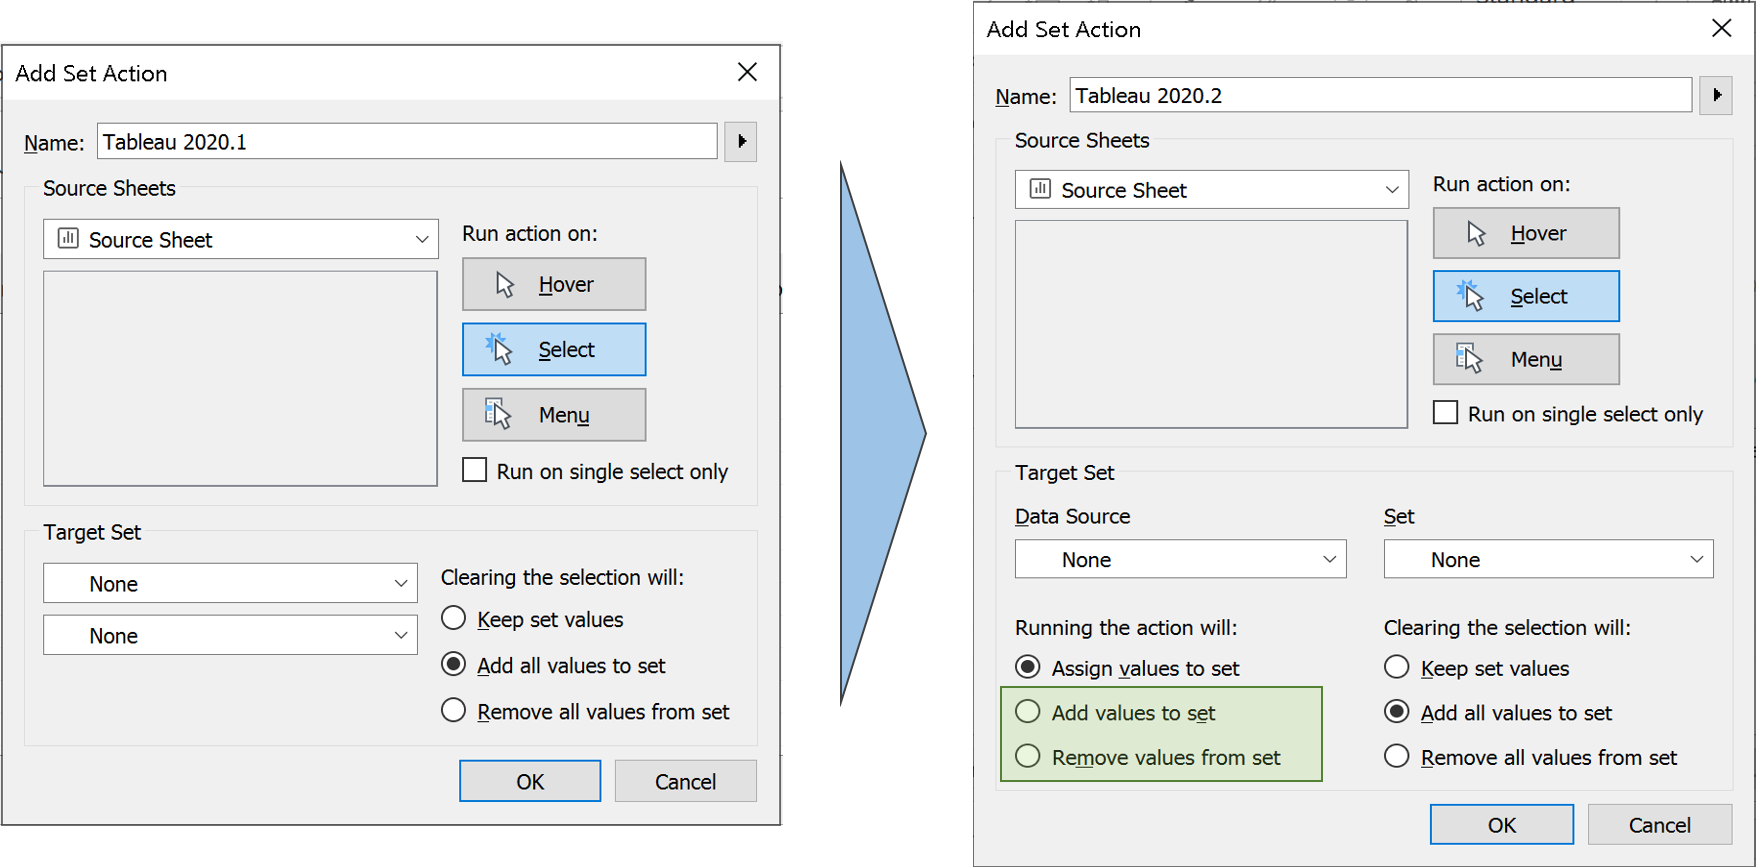
Zen Masters ‘The Flerlage Twins’ have a blog that explains all the features in details about this new set action option. You can check it out.:
4. Other Changes
No Dimensions or Measures:
One of the noticeable differences compared to the previous version, is the absence of sections for Dimensions and Measures. While there is separation line, it is less distracting than the previous versions. It is not only the Dimensions and Measure that got combined, but also the section for Sets. In this version, when you add a Set it will be added as another field in the table, just like a calculated field. This also makes complete sense, since the Sets already have a separate icon to denote them, and it can be clearly understood before using it for any analysis. However, there is a separate section for Parameters.
Always on Search Bar:
Also, the Search bar is now always visible and cannot be hidden, unlike the previous version. I prefer this option since I almost always enable the search and never hides it afterwards. The Search bar sits comfortably in the space that is created when the titles for Dimensions and Measures are removed. In addition, when you type a field name after selecting any field, it automatically goes to that field despite of whether it is Measure or a Dimension. This is similar to us typing a folder or filename to find it in a Windows Folder Explorer.
No more ‘Number of Records’:
Another difference is the absence of ‘Number of Records’ field. This is now replaced with a non-editable and non-removable field: ‘Tablename (Count)’. Since the data is defined by relationship and not joined, there will be multiple such fields if you use multiple data sources. Similarly, when we choose ‘View Data’, there will be multiple tabs based on the number of data sources we use.
I have tried to show these in the image below.

5. Explain Data and Ask Data Improvements
There are significant improvements in these features in every version and this time is no different. Even with all the AI capabilities, there would be times when we want to take control. Explain Data in the new version gives you that extra control that was missing in the earlier version. Authors can now choose which fields to be included in modelling Explain data, giving you the option to input your business logic to it. Explain data also allows you analyse more than just one outlier in the latest version. However, this option seems to be missing for relational databases.

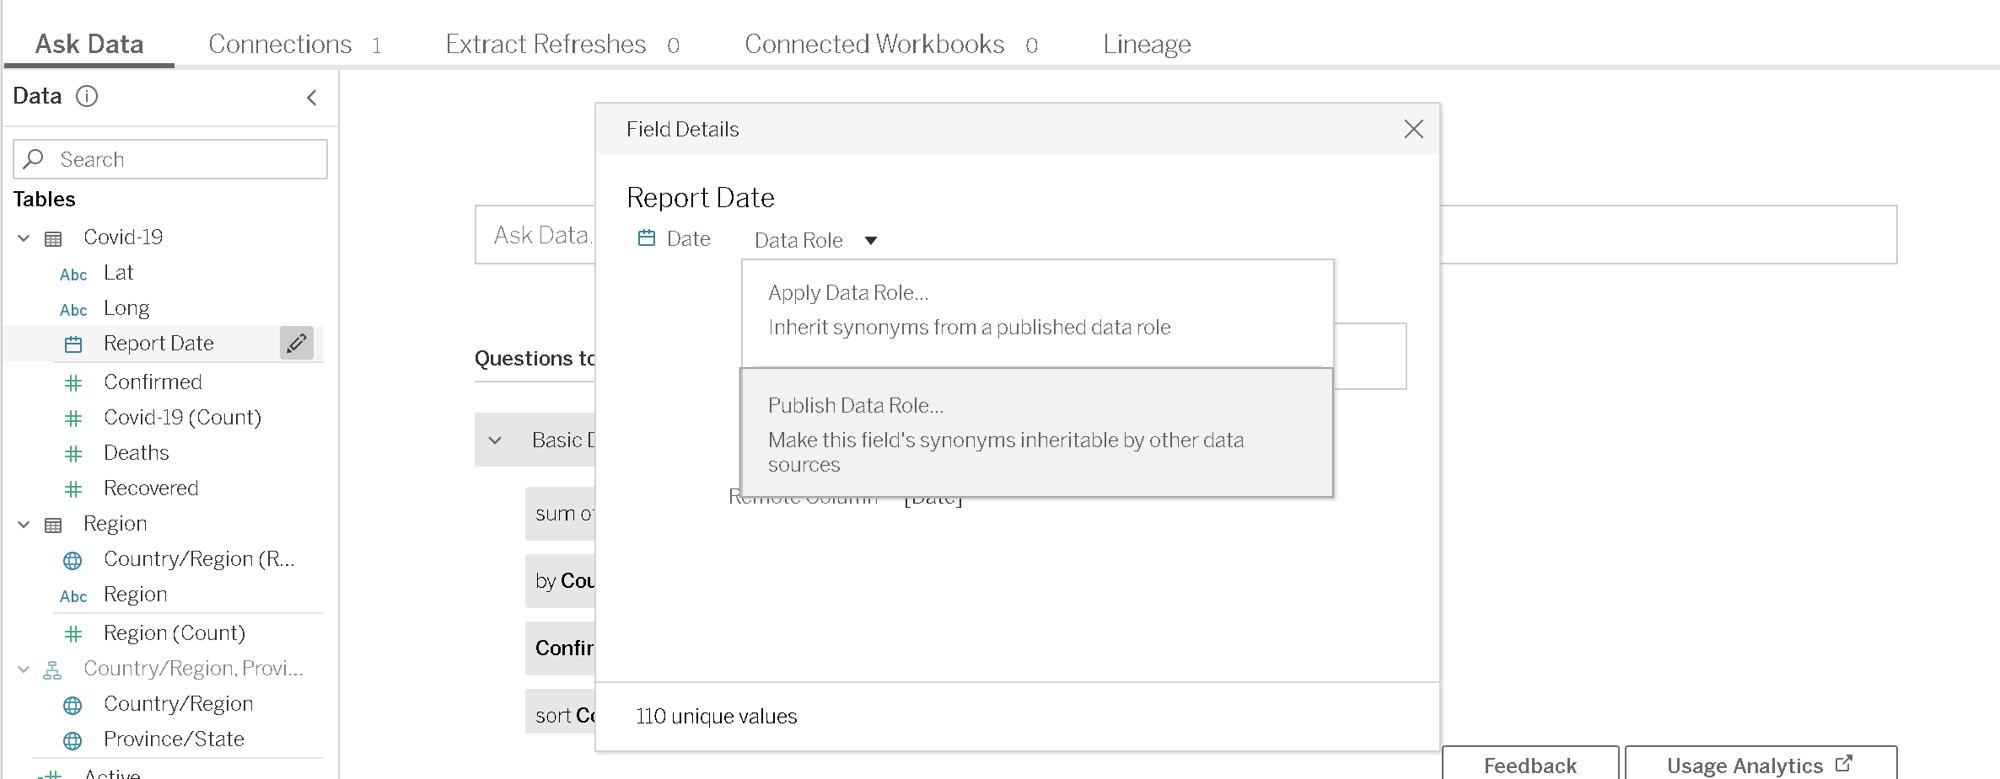
When it comes to Ask Data, you can now provide custom suggestions based on data roles. In addition, the synonyms applied for one field can be published to use across data sources. It also supports scripted data sources in the new version and has some improvements on enterprise controls.
As mentioned at the beginning, there are several other features in Tableau 2020.2. It would be extremely difficult to include all those in just one post. There are other changes like Recommendations on Mobile, Manual sorting of Favourites, publishing directly from the browser without having to open the dashboard on Tableau Desktop etc. and so on.
I hope you got an overview to some of the new features and want to explore more. Let us know your thoughts and how these features were beneficial to you.