Customer Order Frequency
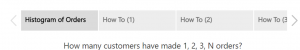
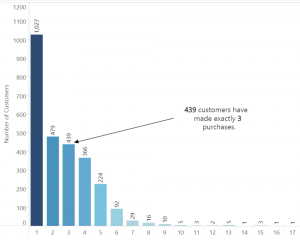
This scenario involves understanding customer order frequency, specifically determining the count of customers who made varying numbers of orders. While calculating the number of orders per customer is straightforward, discerning how many customers placed one, two, or multiple orders requires breaking down the count of customers based on order frequency. Utilizing LOD (Level of Detail) Expressions becomes essential in transforming the count of orders into a dimension that segregates customers by their order count. This process aids in unraveling insights about customer behavior in relation to their order frequency within a sales database where multiple items are present per order.
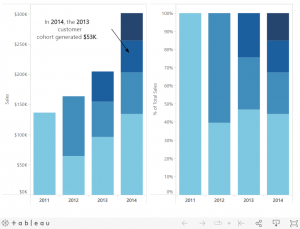
Cohort Analysis
In the pursuit of understanding the impact of customer tenure on sales contributions, cohort analysis is employed to assess whether longer-tenured customers hold more significant sales influence. The presented view categorizes customers based on the year of their initial purchase, facilitating an annual comparison of sales contributions among these cohorts. To determine the first purchase date for each customer, the minimum order date per customer is crucial. However, as the displayed data isn’t structured by customer, employing an LOD (Level of Detail) Expression becomes necessary to establish and retain the minimum order date per individual customer for accurate cohort analysis.

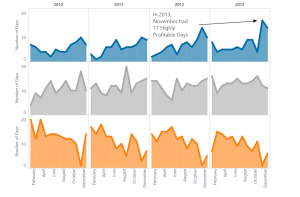
Daily profit KPI
In evaluating daily profit as a key performance indicator (KPI), the focus shifts from observing profit trends over time to quantifying success based on total profit per business day. Understanding the count of profitable days per month or year becomes essential, particularly in investigating potential seasonal impacts. Utilizing LOD (Level of Detail) Expressions, this view demonstrates the seamless creation of bins for aggregated data, like profit per day, despite the underlying data being recorded at a transactional level. This approach allows for efficient analysis and visualization of daily profitability trends within the context of the broader business calendar.

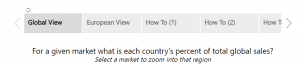
Percent of Total
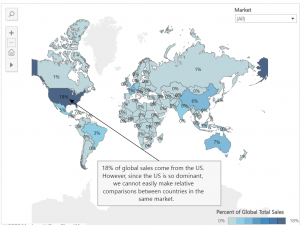
Determining each country’s revenue contribution to global sales is crucial for assessing market performance. When visualized by coloring contributions as percentages, it’s apparent that the US holds the highest share of global sales revenue. However, focusing on markets like the EU, which might have a relatively smaller absolute contribution, becomes challenging without LOD Expressions. Without this capability, filtering by market could lead to recalculating the percent of total, displaying each country’s contribution relative to its market. Using a straightforward LOD Expression enables filtering by market while preserving the measurement of each country’s global contribution, facilitating a more nuanced analysis of market performance within the broader global context.
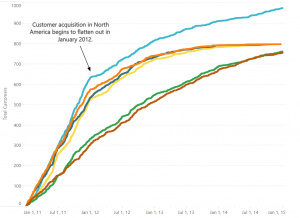
New customer acquisition
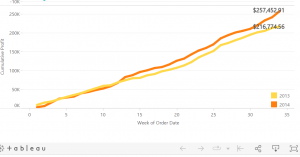
Analyzing the daily trend of total customer acquisition across different markets serves as a crucial metric in assessing the effectiveness of regional marketing and sales efforts in generating new business. By tracking this trend, we gain insights into the performance of these organizations. A steeper line signifies a stronger acquisition trend, while a flattening line suggests a need for increased lead flow.
To accurately measure this trend, it’s imperative to ensure that repeat customers aren’t erroneously counted as new customers. This necessitates using an LOD (Level of Detail) Expression, allowing data evaluation at the customer level despite its visual representation being segmented by market and day. This meticulous approach ensures a precise assessment of new customer acquisition, enabling strategic actions to be taken based on the observed trends.

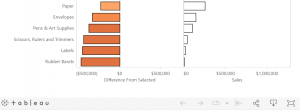
Comparative Sales Analysis
When aiming to determine the difference from a selected category rather than the average, the process becomes more intricate. Initially, isolating the sales figures of the chosen category is necessary. Subsequently, employing an EXCLUDE Expression becomes crucial to reiterate that value across all other categories. This technique enables a straightforward calculation of the difference between each category’s sales and the rest, allowing for a comparative sales analysis that emphasizes the disparity between the selected category and others.

Average of top deals by sales rep
Determining the largest deal closed by each sales representative and subsequently computing the average of these top deals by country is a multi-layered analysis. LOD (Level of Detail) Expressions play a pivotal role in dissecting data down to the sales rep level, even when the visualization displays information at the country level.
The presented view showcases the average top deal size by sales rep, offering insights where countries colored blue exhibit higher average top deal sizes, while those colored orange indicate comparatively lower averages. This information serves as a guide for further drill-down analysis from the country level to the sales rep level, facilitating a deeper understanding of performance variations across both geographical and individual sales rep perspectives.


Actual vs. Target
Within this visualization, we present the variance between actual and target profits per state for a chain of coffee houses. The top view distinctly showcases states surpassing or falling short of set targets. Yet, this aggregated view might overlook subtleties: some states exceed targets due to every product sold meeting or exceeding goals, while others rely on a single product surpassing its target to compensate for others missing theirs. Employing an LOD Expression enables the identification of the percentage of products sold within a state that surpass their set targets, offering a more nuanced assessment.


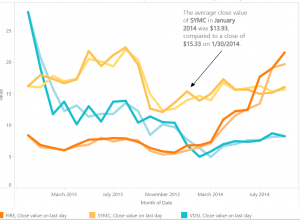
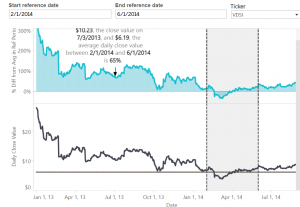
Value on the Last Day of a Period
Data reflecting specific day statuses—like inventory, employee headcounts, or daily stock values—require distinct handling compared to aggregatable metrics like sales or profit. Displaying the value on the last calendar day of a month holds significance in such cases. Moreover, transitioning from a monthly to a weekly view should dynamically update to showcase the last day of the week. For instance, in the stock data example below, assessing multiple ticker values at a daily level compares the average daily close value against the close value on the final day of the period. Employing a straightforward LOD Expression enables diving into daily granularity even within a visual display at a higher level of aggregation.

The following 6 examples illustrate how level of detail expressions can be applied to more advanced scenarios:
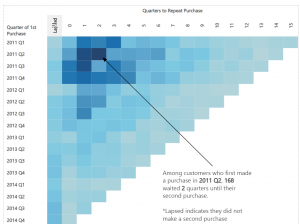
Evaluating the return purchases among customers holds significance, especially considering the costliness of acquiring new customers. Understanding the patterns of customers making repeat purchases within varying quarters—whether it’s the first, second, third, or beyond—is essential. Additionally, assessing the count of customers who have never made a repeat purchase contributes valuable insights. This analysis, segmented by quarterly cohorts, sheds light on customer behavior over time.
Leveraging a FIXED Expression becomes instrumental in identifying each customer’s first and second purchase dates, enabling the derivation of the time span in quarters for a repeat purchase. This nuanced approach offers a comprehensive understanding of customer return behavior within distinct quarterly cohorts.

Percent Difference from Average Across a Range
While Example 6 highlights comparing against a single selected item, what if the aim is to assess comparisons across a spectrum of values? Consider a scenario where one desires to evaluate the daily close value of a stock against the average daily close value before a significant industry-impacting event occurs.
In such instances, examining the percent difference becomes essential. By comparing the daily stock close values against the pre-event average, insights into the magnitude and impact of the event on stock performance can be gleaned. This analysis offers a broader perspective, aiding in understanding the deviation from the average within the context of industry-wide fluctuations.
Relative period filtering
When analyzing performance through year-to-date (YTD) and month-to-date (MTD) comparisons relative to the previous year, filtering relative to today is straightforward. However, when data undergoes weekly refreshes, discrepancies can arise. For instance, if the last refresh was on March 1 but the current day is March 7, a month-to-date comparison might inadvertently compare March 1 through March 7 of the previous year against March 1 of the current year, potentially causing unwarranted concern.
Employing a simple LOD (Level of Detail) Expression resolves this issue by identifying the maximum date within the dataset. This approach ensures accurate time-based comparisons, preventing misleading contrasts between different periods and providing a more precise evaluation of performance trends.

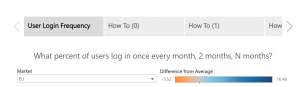
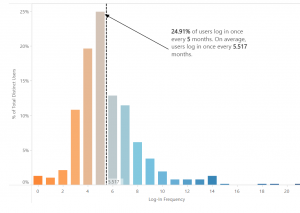
User login frequency
Understanding user login frequency is pivotal for assessing user engagement on websites or applications. This analysis aims to segment users based on their login frequency—whether it’s monthly, bi-monthly, quarterly, and so on—and derive insights regarding the average login rate and its distribution around this average.
The dataset’s granularity involves a log-in date per user ID, implying a row for each day a user accesses the platform. Slicing the number of customers by their login rate entails a more intricate analysis, necessitating the slicing of one measure by another measure. As showcased in Example 1, leveraging LOD (Level of Detail) Expressions streamlines this analysis, enabling an easy breakdown of user cohorts based on their login frequency and facilitating a comprehensive understanding of user behavior.
Proportional Brushing
In the realm of analysis, the pivotal question often revolves around comparison—specifically, “Compared to what?” Proportional brushing introduces a valuable technique for filtering where the aim is not merely to narrow down to the selection but to compare the selection against the total context.
This approach allows for a more comprehensive analysis by providing insights into how the selected subset relates to the entirety of the dataset. Proportional brushing aids in understanding the significance and impact of the chosen subset within the broader context, offering a richer perspective for informed decision-making.

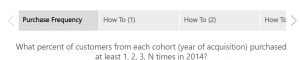
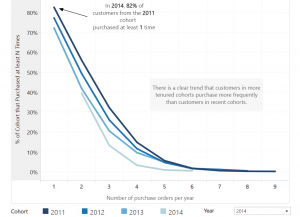
Examining the correlation between customer tenure, measured by the year of acquisition, and loyalty, gauged through annual purchase frequency, provides valuable insights into customer behavior.
While Example 1 illustrates customers purchasing a specific number of times, marketers often seek insights beyond exact counts—particularly identifying customers who purchased at least a certain number of times. Moreover, understanding the loyalty trends within different acquisition cohorts is crucial. Simply assessing absolute customer numbers across cohorts might not reveal nuanced insights. Therefore, a more insightful approach involves evaluating the percentage of total customers within each cohort based on their purchase frequency thresholds.
In essence, this analysis combines variations of the number of orders LOD Expression, cohort Expression, and percent-of-total Expression to determine what percentage of customers within each cohort made at least one, two, three, or more purchases in a year. This approach offers a comprehensive understanding of loyalty trends across different customer acquisition periods.