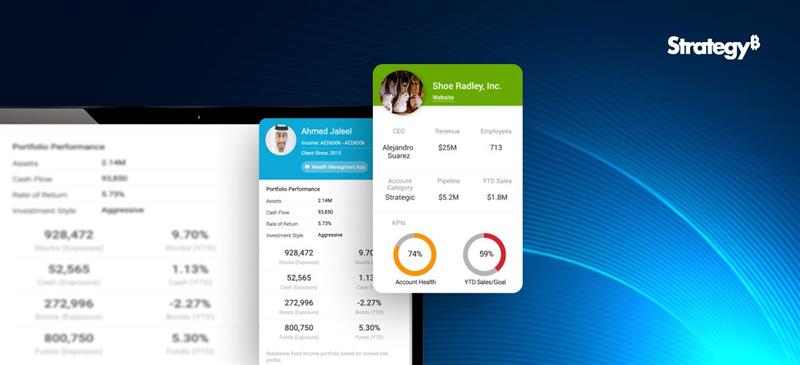
Setting Up Metrics Is a Breeze
Configuring metrics in Tableau Pulse takes just minutes. Whether it’s setting up your own custom metrics or utilizing pre-defined ones, the process is straightforward and user-friendly. And once set up, the visuals, descriptions, and insights are generated automatically, enabling team members to stay updated on performance with ease.
Pro Tip: You can also customize existing metrics to meet specific goals. For example, a custom metric was developed to track interactions generated by teams in the field, with a target of reaching a high engagement level within a set timeframe. This tailored approach has streamlined the process of monitoring performance and recognizing accomplishments.
Integrating Data into the Flow of Work
Tableau Pulse effortlessly integrates data into the tools you use daily, like Slack or email, allowing you to stay informed without disrupting your workflow. Each morning, you can start your day by reviewing the Pulse Digest in Slack, which provides a snapshot of key metrics, trends, and insights.
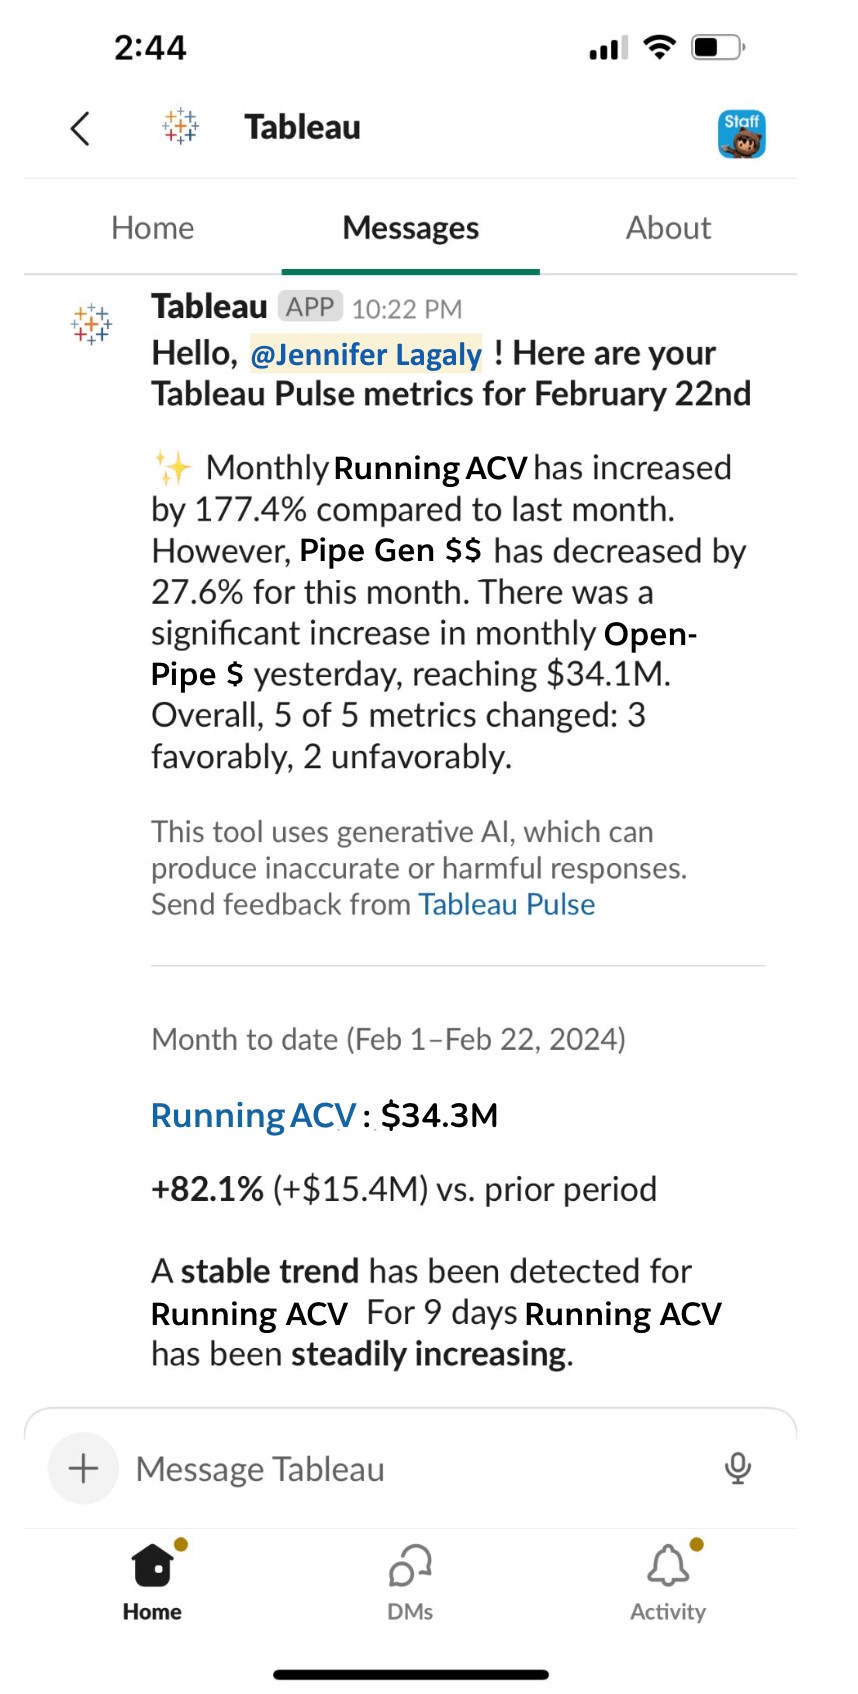
Source:https://www.tableau.com/blog/how-tableau-chief-revenue-officer-uses-tableau-pulse
Decipher Trends with Intelligent Metrics
Monitoring metrics is not solely focused on tracking numbers; it also involves identifying opportunities and addressing challenges. With AI-generated summaries of key metrics like Annual Contract Value (ACV) and Pipeline Generation, Tableau Pulse helps you understand the context behind the data. The live updates ensure that any changes are reflected immediately, providing real-time insights that are always up-to-date.
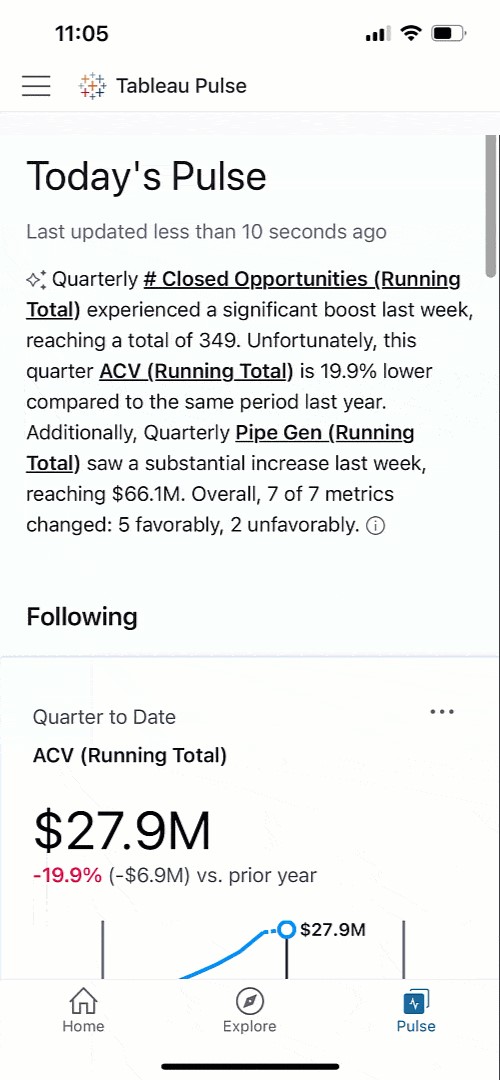
Get a Clear View of Business Performance
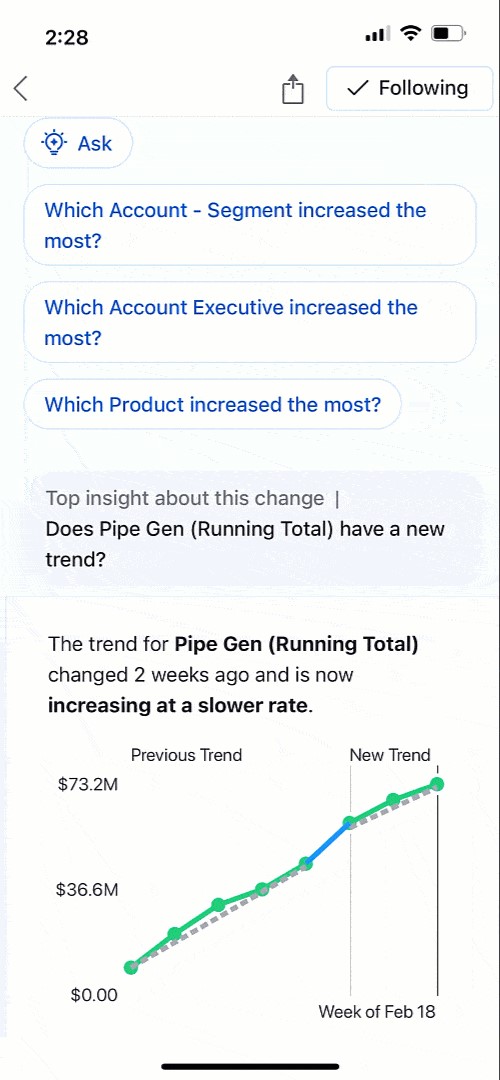
Tableau Pulse’s intuitive visualizations and natural language summaries make it easy to compare current and past performance, helping you identify areas that may need closer attention. For instance, if Pipeline Generation is up 10.9% year over year but showing signs of slowing, Pulse allows you to dig deeper, understand the cause, and take timely action to keep growth on track.
Tableau Pulse is available on mobile, and these insights are accessible wherever you are, making it easy to stay connected to your data on the go.
Analyze Business Segments with Precision
Tableau Pulse enables detailed analysis of various business segments, offering a clear view of how different teams and departments contribute to overall success. With just a click, you can explore revenue trends, track team performance, and understand the impact of different strategies across the organization.
This level of analysis, which once required hours of manual work, is now at your fingertips. You can easily filter by segment, product, or deal size to gain nuanced insights that drive better decision-making.
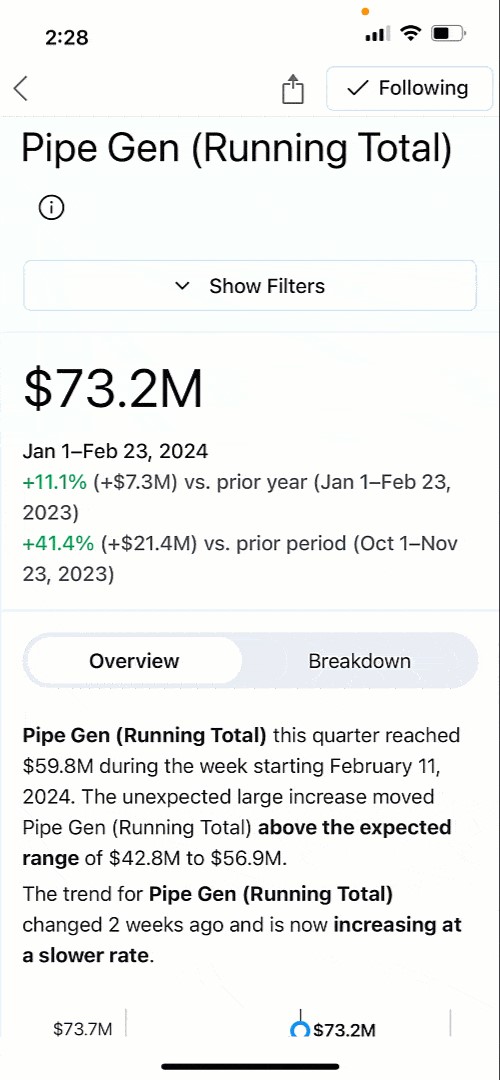
Ask Smart, Data-Driven Questions
Powered by AI, Tableau Pulse does more than just report numbers. It actively helps you explore trends by suggesting relevant questions and providing insights in clear, understandable language. Whether it’s identifying which sales regions are thriving or where potential issues may arise, Pulse empowers you to make data-driven decisions with confidence.
Foster a Data-Driven Culture
Tableau Pulse is designed to be accessible to everyone, regardless of their level of data expertise. By integrating insights into tools like Slack, Pulse ensures that critical information is always at hand, promoting a culture of informed decision-making across the organization. This democratization of data means that every team member can contribute meaningfully to achieving our shared goals.
Tableau Pulse has truly transformed how we approach strategic decisions, placing personalized, contextually relevant insights directly in our workflow. It empowers everyone to be data-driven, aligning efforts towards achieving your company objectives and navigating the dynamic challenges of business with agility and insight.
Want to Transform Your Business?
Watch our demo to see how Tableau Pulse, powered by Tableau AI, can elevate your business strategy, and start your free Tableau Pulse trial today: https://www.beinex.com/free-tableau-software/

