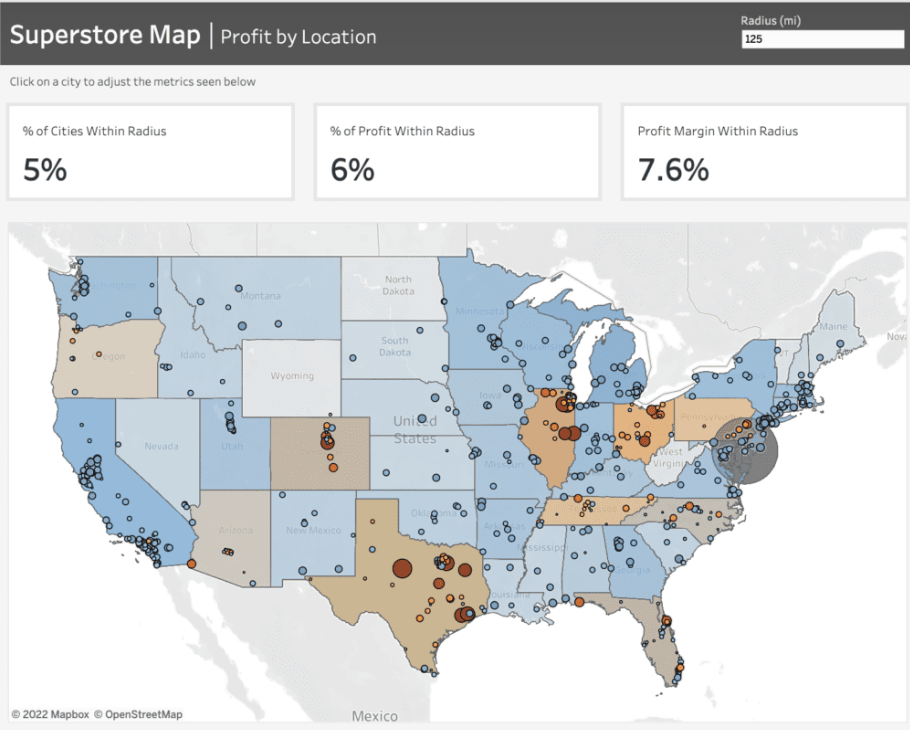
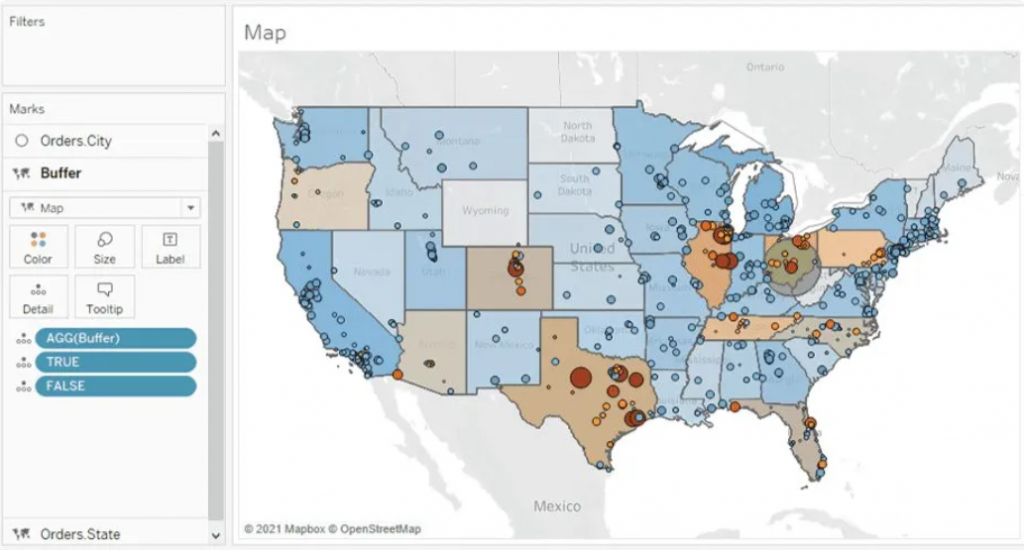
For instance, the dashboard given below mirrors a project undertaken for a client seeking insights into the pandemic’s impact on their business across specific areas. They wanted to determine the number of stores stocking their product within a defined radius, highlighting the local business impact amid the pandemic.
To craft the map showcased in this dashboard, we leverage Tableau’s map layers feature introduced in version 2020.4. For further insights into this functionality, additional details can be found here.
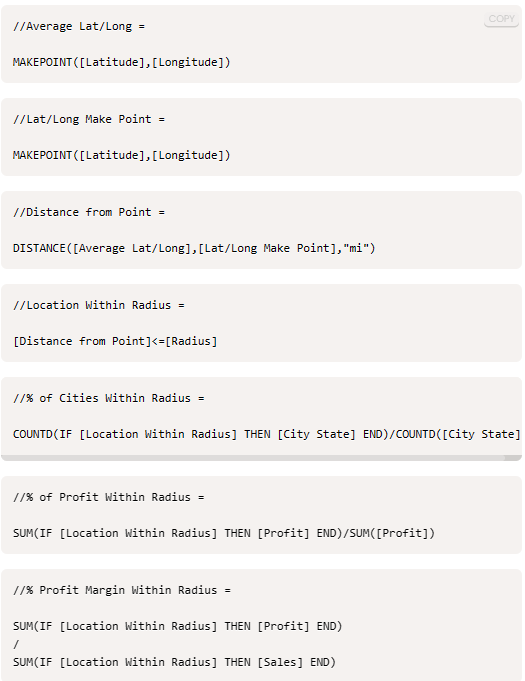
Prior to initiating the map creation process, frequently refer to the Profit Margin field. Here’s the calculation for this field: it computes the percentage of Sales that translates into Profit. This calculation enables us to gauge the profitability derived from our sales figures.

For the States map layer, the State field is utilized and placed on the ‘Detail’ shelf. Each state is color-coded based on its Profit Margin.
Moving to the Cities layer, the City field is added onto the top left area labeled “Add a Marks Layer.” To ensure the visibility of every city, the State level of detail is included as well. This accounts for cities existing in multiple states, displaying every city/state combination. Cities are color-coded using the Profit Margin field, with additional color based on the absolute value of the Profit Margin. This helps visualize the range and direction of profitability for each city.
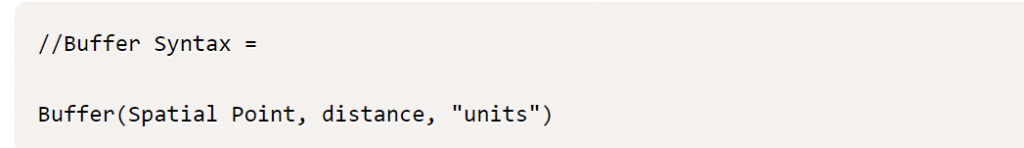
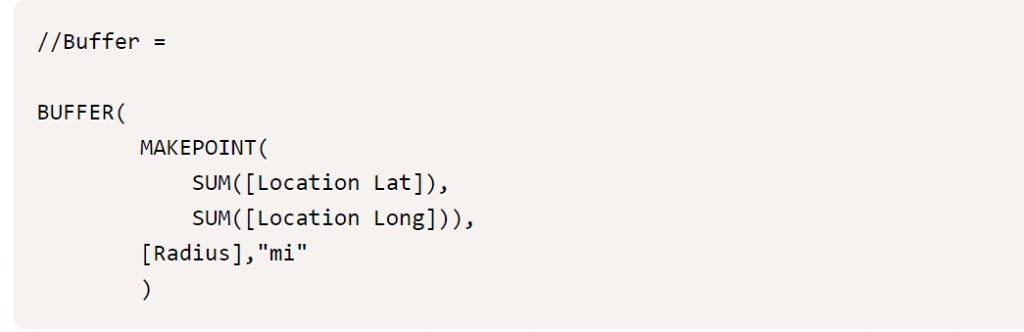
Buffer Calculation
The Buffer calculation generates a radius, known as a “buffer,” around a specific map point, defined within the syntax parameters. Here’s the syntax breakdown for the Buffer: The initial part determines the center location, followed by the distance around the point, and finally, the chosen unit of measurement.
To establish the desired centroid point, we employ the Makepoint function. This function simply utilizes latitude and longitude coordinates to generate a point on the map. Below is the calculation illustrating its usage.
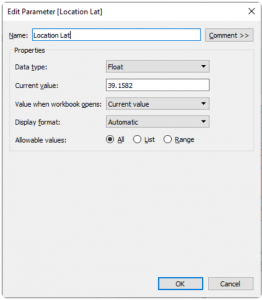
To achieve the interactivity you desire, you’ll begin by creating three parameters: [Location Lat], [Location Long], and [Radius]. These parameters offer flexibility, allowing you to adjust them within the dashboard interface.
As you click on different cities, the [Location Lat] and [Location Long] fields dynamically change, altering the central point. Meanwhile, the [Radius] field, functioning as an input parameter, enables you to modify the radius distance according to your preferences. This setup grants you personalized control over these parameters directly within the dashboard.
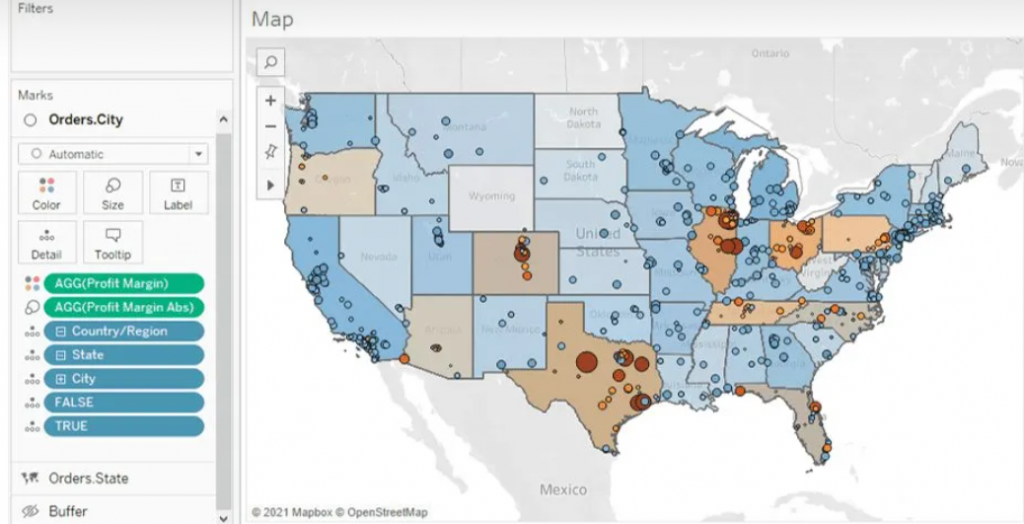
With the creation of the final map layer field, you can now drag this field to the top left of the map and add it to the existing layers. Once done, you’ll have all the map layers integrated into the map, allowing you to recreate the dashboard as depicted below. This comprehensive setup will mirror the dashboard layout and functionality.
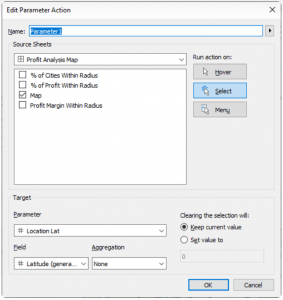
Parameter Actions
Parameter Actions are essential at this stage to ensure dynamic interaction within the map layers. By implementing parameter actions, we enable the Location Lat and Location Long fields to adjust dynamically when clicking on a city. This action directly affects the MAKEPOINT() field within the Buffer calculation, effectively altering the radius location. Below, you can observe the setup of the parameter action and how it facilitates this dynamic transformation.
Finally, we aim for these parameters to influence the available metrics showcased at the top of the dashboard. These metrics offer insights into the concentration of profit and profit margin within the selected radius. Below, you’ll find the supporting calculations and the formulae for the metrics displayed on the dashboard. These metrics serve as indicators of profitability and profit margin concentration within the chosen radius.
Wrapping up, creating interactive data visualizations opens doors to explore and comprehend information, fostering informed decision-making and exploration of new analytical paths.