“The functions, even as they may look simple, are pretty useful for any Tableau Consultant especially if they are working on finance-related projects,”
What is Tableau Sum and Running Sum?
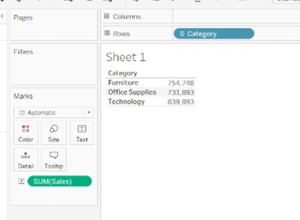
Sum
SUM is one of the commonly performed functions in Tableau. The Tableau Sum function seeks out the Sum of records under consideration. It is the total of the values present in a field. The screenshot provided below exhibits the total sum of sales for each of the three categories as given in Sheet 1.
In the sample dataset shown below, the sum of sales is shown corresponding to each of the corresponding values in the dimension “Category”. For example, “Furniture” has a total sale of 754,748, which could be comprising of furniture related products such as Tables, Chairs etc.
Running Sum
A RUNNING SUM is a cumulative total in a row or column from the first value to the final value in the respective row or column. For instance, in the example given below, the cumulative values of Furniture and Office Supplies stand at 1,486,641 and that value when added to Technology’s value of 839,893 gives 2,326,534.

You can summarise or modify the granularity of your data using aggregate functions. An aggregate part combines the values of multiple lines to provide a single value. Examples of aggregate functions apart from sum are measurements based on Count, Count Distinct, Fixed Calculations, and other standard integration functions.
Every time you include a measure in your view, an aggregate is automatically applied to that measure. Depending on the context of the view, different aggregation techniques are used. Analysts can well utilise these features to simplify the whole complex process of data analysis, and organisations can harness them for insightful decisions.