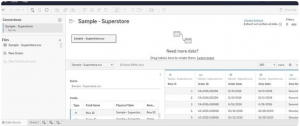
To start, access the Superstore Dataset, available for download on Kaggle. Use Tableau Public to connect to this dataset and explore the rows and columns to understand the documented data related to the Superstore. This exploration sets the stage for the subsequent cohort retention analysis.
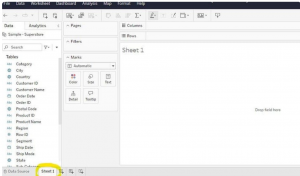
Move over to the Sheet 1 tab; this will serve as your dedicated workspace where you’ll craft your visualizations. This area will be your canvas to build and design the subsequent analyses and visual representations.
To perform cohort analysis effectively, specific data points are necessary:
Unique Identifier: Utilize the Customer ID as the unique identifier for each customer.
First Purchase Date: This marks the date when a customer made their initial purchase, a pivotal point for creating cohort groups.
Revenue Data: Information regarding the financial aspect of each transaction.
Creating Calculated Fields
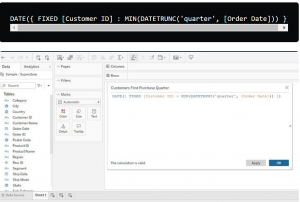
One crucial calculated field needed is the “Customers’ First Purchase Date (quarter).” Since the dataset doesn’t contain the first purchase date field, a calculated field is essential. This field is derived from computations based on existing data in the dataset, enabling the identification of when each customer made their initial purchase. Calculated fields are instrumental in manipulating and analyzing data by performing calculations based on existing dataset information.

To create quarter and year cohorts based on the customers’ first purchase date:
Defining Cohorts: In this dataset spanning four years (2014–2017), cohorts will be based on the quarter and year when customers made their initial purchase. This approach ensures a manageable cohort table for analysis.
Calculation for Quarter Identification: The calculation to establish the quarter in which a customer made their first purchase involves determining the quarter and year from the purchase date.
This calculation utilizes the ‘DATETRUNC’ function to extract the quarter from the ‘First Purchase Date’ field, aligning customers based on the quarter they made their initial purchase.
Flexibility in Cohort Creation: While quarters and years are chosen for cohort segmentation in this scenario, other time parameters like days, weeks, or months could also be used for cohort creation, depending on the dataset and analytical objectives. However, for this particular dataset, quarters and years were deemed more practical for effective analysis.
Assembling the cohort retention table involves using the calculated fields previously created to form a comprehensive table that illustrates cohort-based metrics, particularly the number of unique customers per first quarter and the retention rate.
Here’s how to assemble the cohort table:

![]()
This formula divides the count of unique customers by the total number of customers from the first quarter, providing the retention rate for each subsequent period.
This table allows for a clear visualization of how customer retention varies across different cohorts over subsequent periods, providing insights into the effectiveness of retaining customers acquired in specific quarters.
This step-by-step guide is incredibly detailed for constructing the cohort table in Tableau. It breaks down the process systematically, ensuring proper visualization of the cohort analysis.
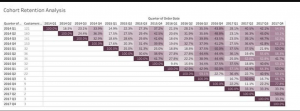
Interpreting the retention rates from this table involves examining both the rows and columns:
Rows (First and Second Columns): Here, you’ll find different year and quarter groups representing cohorts, along with the count of customers who made their first purchase in each respective period.
Columns (Third Column): As you move across the table, you’ll encounter the percentages indicating how many customers continued making purchases at the Superstore across subsequent quarters after their initial purchase.
For instance, if 160 customers made their first purchase in 2014 Q2, you’d observe that 24.4% returned to make purchases in 2014 Q3, and 36.3% made purchases in 2014 Q4. This trend continues across the subsequent periods.
In conclusion, creating calculated fields is an essential part of conducting cohort analysis in Tableau. It involves utilizing functions effectively. If you’re new to Tableau functions, exploring articles or resources on Tableau functions could fill any knowledge gaps and provide a deeper understanding of their usage in data analysis and visualization. The provided Tableau article on functions might be particularly helpful for a more comprehensive understanding.