What is Business Intelligence?
Business intelligence (BI) is an analysis that uses business-related strategies and technologies to assess, process, and interpret business information. This type of information helps businesses understand the current state of their organization and make informed decisions on how to take actions that are likely to yield their intended results.
Leveraging business intelligence insights offers several benefits to employers and employees, including strengthening performance and improving efficiency. For example, insights from business intelligence metrics can help employers understand where supply chain function might be breaking down or provide a snapshot of consumer products performing above or below expectations.
Top Trends in Business Intelligence in 2024
Finding the latest trends in BI can help your organization stay competitive and maximize your ability to use your data. While trends continually shift by nature, the following areas have rapidly risen in demand and application.
1. Augmented Analytics
Augmented analytics is an approach to data analytics that employs advanced technologies such as AI and machine learning to automate data preparation, insight generation, and insight sharing.
In 2023, the global augmented analytics market was valued at USD 8.9 billion, marking a significant milestone in data-driven technologies. The market is on track for impressive expansion, with estimates predicting its value will climb to USD 11.6 billion in 2024 and soar to USD 91.4 billion by 2032. This remarkable growth, reflected in a compound annual growth rate (CAGR) of 29.4% between 2024 and 2032, underscores the rising importance of advanced analytics in transforming business intelligence and decision-making processes across industries.
Here are the advantages of augmented analytics:
Advantages:
• Increased Efficiency: Automates data preparation, saving up to 60% of man-hours spent on manual data processing.
• Broader Accessibility: Empowers non-technical users to gain insights, reducing dependency on data specialists by 40%.
• Real-World Impact: Organizations using augmented analytics report a 25% increase in productivity due to faster decision-making.
2. Natural Language Processing (NLP)
Natural Language Processing (NLP) is a confluence of computational linguistics and artificial intelligence that enables machines to understand, interpret, generate, and respond to human language meaningfully and contextually. An example of a program that utilizes natural language processing is ChatGPT.
The Natural Language Processing (NLP) market is projected to reach a value of USD 36.4 billion in 2024. With a robust compound annual growth rate (CAGR) of 27.5% from 2024 to 2030, the market is expected to expand significantly, reaching a volume of USD 156.8 billion by 2030. This rapid growth highlights the increasing adoption of NLP technologies across various industries, driving advancements in AI-driven communication and analytics tools.
The advantages of Natural Language Processing (NLP) within the business intelligence landscape:
Advantages:
• Enhanced User Engagement: Reduces the learning curve for data tools, increasing user adoption by up to 30%.
• Customer Insights: Companies using NLP for sentiment analysis report a 15% increase in customer satisfaction.
3. Data Storytelling
The growing dependence on data in the corporate landscape brings forth the need for data interpretation that extends beyond traditional methods. The narrative structure is one of the primary differentiators between data storytelling and data visualization. While data visualization can provide a visual representation of what the data is saying, data storytelling explains why the data matters, providing a more comprehensive understanding of the insights.
According to Gartner, by 2025, data stories will become the most common method for consuming analytics, and data storytelling will dominate BI, with 75% of these stories being automatically produced through augmented analytics techniques.
Advantages:
• Better Understanding: Enhances comprehension of complex data, leading to a 20% reduction in misinterpretation.
• Improved Decision-Making: Organizations using data storytelling have reported a 15% increase in strategic decision outcomes.
4. Self-Service Analytics
Another BI trend is self-service analytics. It is a form of business intelligence wherein end-users, such as marketing professionals, are enabled to conduct data analyses and generate reports without the direct assistance of IT or data science teams.
The self-service BI market is projected to reach USD 30 billion by 2036, expanding at a compound annual growth rate (CAGR) of 8% between 2024 and 2036. In 2023, the market size was valued at over USD 18 billion. This substantial growth is driven by the increasing demand for data democratization, as organizations seek to dismantle traditional data silos and enable non-technical users to access, analyze, and extract insights from data independently.
Advantages:
• Time Savings: Reduces report generation time by up to 50%, allowing for faster data-driven decisions.
• Empowered Employees: Decreases IT workload by 30%, enabling more focus on strategic projects.
5. Decision Intelligence
DI goes beyond traditional analytics by creating a semantic framework that incorporates business rules and context, enabling predictive analytics to generate actionable, future-focused insights. This empowers organizations to make more informed and strategic decisions, often automating routine choices and accelerating complex ones.
The DI market is on a robust growth trajectory, projected to surge from $13.3 billion in 2024 to a remarkable $50.1 billion by 2030. As businesses increasingly prioritize data-driven strategies, DI stands out as a pivotal tool for enhancing decision-making agility and precision, ensuring organizations stay ahead in a competitive landscape.
Advantages:
• Automated Decision-Making: Increases decision speed by up to 40%, significantly reducing time-to-insight.
• Enhanced Strategic Planning: Companies using DI report a 25% improvement in strategic planning accuracy.
6. Predictive Analytics
Predictive analytics is an advanced form of analytics that uses historical data, statistical algorithms, and machine-learning techniques to predict future events and trends.
The predictive analytics market is projected to grow by USD 38.6 billion, at a CAGR of 28.9%, between 2023 and 2028. This rapid expansion is fueled by increasing demand for data-driven decision-making, advancements in AI and machine learning technologies, and the rising adoption of predictive analytics across various sectors, including finance, healthcare, and retail.
Advantages:
• Proactive Decision-Making: Reduces operational costs by up to 15% through accurate demand forecasting.
• Risk Mitigation: Enhances risk assessment accuracy, leading to a 20% reduction in potential losses.
7. Artificial Intelligence (AI) in BI
Another emerging BI trend is the greater infusion of AI in business intelligence. AI’s ability to automate data analysis, generate insights, and predict outcomes is redefining the way organizations interact with data. The Artificial Intelligence market is projected to reach a size of USD 184.0 billion in 2024, with an expected annual growth rate (CAGR) of 28.4% from 2024 to 2030. This growth is anticipated to result in a market volume of USD 826.7 billion by 2030.
AI in BI typically involves the application of machine learning algorithms and advanced analytics techniques to automate data processing and interpretation tasks. From data collection and cleaning to analysis and insight generation, AI can significantly reduce the manual workload, speeding up the entire BI process.
Advantages:
• Operational Efficiency: Automates 70% of data analysis tasks, freeing up resources for strategic activities.
• Cost Reduction: Reduces the cost of data processing by up to 20%
8. Advanced Data Visualization
Advanced data visualization goes beyond basic charts and graphs, incorporating a variety of innovative visual elements such as heat maps, geographical maps, scatter plots, treemaps, and more into the dashboard design. These elements enable the presentation of multi-dimensional data in a single view, facilitating a more comprehensive understanding of the data.
The global data visualization market showcased a strong value of USD 4.5 billion in 2017, highlighting the growing demand for effectively presenting complex data. By 2023, the market is expected to surge to USD 7.7 billion, reflecting a robust CAGR of 9.47%.
Advantages:
• Improved Insights: Increases data interpretation accuracy by 30%.
• Enhanced Collaboration: Boosts cross-departmental collaboration by 25% through shared visual insights.
9. Mobile BI
Mobile business intelligence (BI) involves the use of mobile devices to access BI applications and data, enabling decision-makers to stay informed and make decisions, irrespective of their location. The global mobile business intelligence market, valued at USD 13.8 billion in 2023, is expected to grow at a CAGR of 15.3%, reaching USD 51.5 billion by 2032.
Advantages:
• Increased Accessibility: Provides real-time data access, enhancing decision-making speed by 35%.
• Boosted Productivity: Enables on-the-go analysis, increasing productivity by 20%.
10. Ethical Data Governance
The last BI trend on the list is ethical data governance, which addresses policies, procedures, and structures that ensure data quality and security, and ethical considerations related to data collection, processing, and use. The global data governance market is projected to reach USD 4.1 billion in 2024 and is expected to grow at a CAGR of 18.5% over the next decade, reaching USD 22.5 billion by 2034.
The central principle behind Ethical Data Governance is respecting individual privacy and rights in all data activities. It involves implementing practices that ensure informed consent, data anonymization, and stringent access controls, among others, to protect individual privacy and prevent data misuse.
Advantages:
• Compliance Efficiency: Reduces compliance-related costs by up to 25%.
• Increased Trust: Builds customer trust, leading to a 10% increase in brand loyalty.
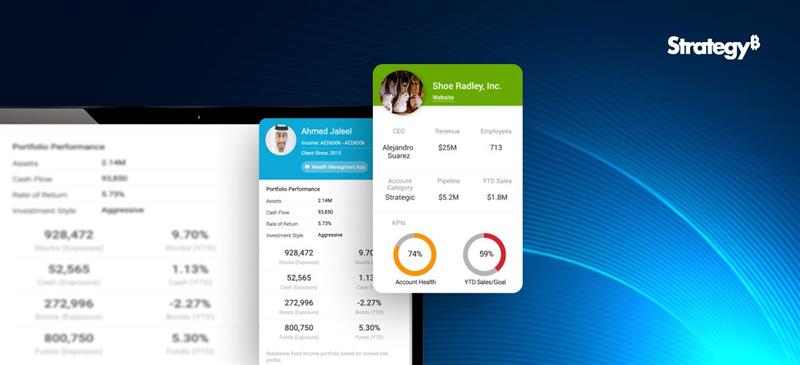
Tableau in Action: Leveraging Latest BI Trends
Tableau integrates the latest BI trends into practical applications, enhancing decision-making and data insights. Let’s examine how some of the top BI trends are applied within Tableau.
Here are a few examples:
- Augmented Analytics: With Tableau Einstein Discovery, companies can automate insights and speed up decision-making, especially in retail and finance.
- Natural Language Processing: Tableau’s NLP system allows users to explore data using simple language, enabling faster data processing without coding.
- Data Storytelling: Story Points help craft compelling narratives, increasing stakeholder engagement in areas like marketing and sales.
- Self-Service Analytics: Tableau enables business users to independently explore data, reducing IT workload and accelerating decisions in finance and supply chain.
- Predictive Analytics: Integrating with Einstein Discovery, Tableau’s predictive capabilities help industries like healthcare forecast trends and optimize operations.
- Mobile BI: Tableau’s mobile app allows for real-time access to data, improving productivity for on-the-go teams like sales.
For a free Tableau demo, connect with us: www.beinex.com/free-tableau-software/