Data preparation is purging imperfectly formed data, reorganising unclean data, and merging various data sets for analysis. Rows and columns in the data structure must be changed, and data types and values must be cleaned up. The amount of time it takes to find insights directly depends on how quickly and well you prepare your data. The entire process can be sped up by being aware of the extent of the data you’re studying and observing the modifications you make to the data.
With the help of Tableau Prep Builder, data can be combined, shaped, and cleaned more quickly and easily for analysis within Tableau. You can swiftly obtain high-quality data using the linear and visual approach when preparing your data.
When ushering in data into a data prep tool, it is always better to know what you’re working with and whether you’re looking at the complete data set or just a subset. Before you begin cleaning, you might also need to undertake some data research. Five crucial steps are to be taken care of for prepping the data.
Let’s have a look:
1. Adjust the data sample size
To speed up your data preparation process and improve performance, you should generally only connect to a small portion of a vast data set. You might occasionally prefer to view the entire data set, and Tableau Prep enables you to do so. If a sample doesn’t help you complete your data preparation task, you can try the following:
- a. Boost the size of your data sample: Adjust the sample’s row count by returning to the input stage. You can add more rows or include all the data but remember that doing so might make the performance slower. Another word of caution is that utilising a specified number of rows will only return the fastest method the underlying database can find to replace the given rows.
- b. Take random sampling: Tableau Prep automatically chooses the optimal number of rows to return based on the total number of fields in the collection and the data types of those columns. The database level random sampling occurs and returns the specified number of rows. The database returns a sample after inspecting each entry. Not all data sources provide this option, which could also affect performance.
- c. Add a step filter at the input stage: You may ensure that the information pulled into your data set is pertinent to your research by including a filter at the input stage. This improves performance while providing you with a more representative sample.

2.Evaluate the data
You’ll probably want to start by counting the number of distinct values in each field. A simple check at the column header at the top reveals how many states are represented in the data set. You’ll also want to understand how various values connect to identify data outliers or problems. You can utilise highlighting in Tableau Prep to find correlations between different fields. The data grid view is condensed to only display the records with the selected value in the chosen field when you click on a value in the profile pane. Tableau Prep highlights the corresponding values in blue, and the values span areas.

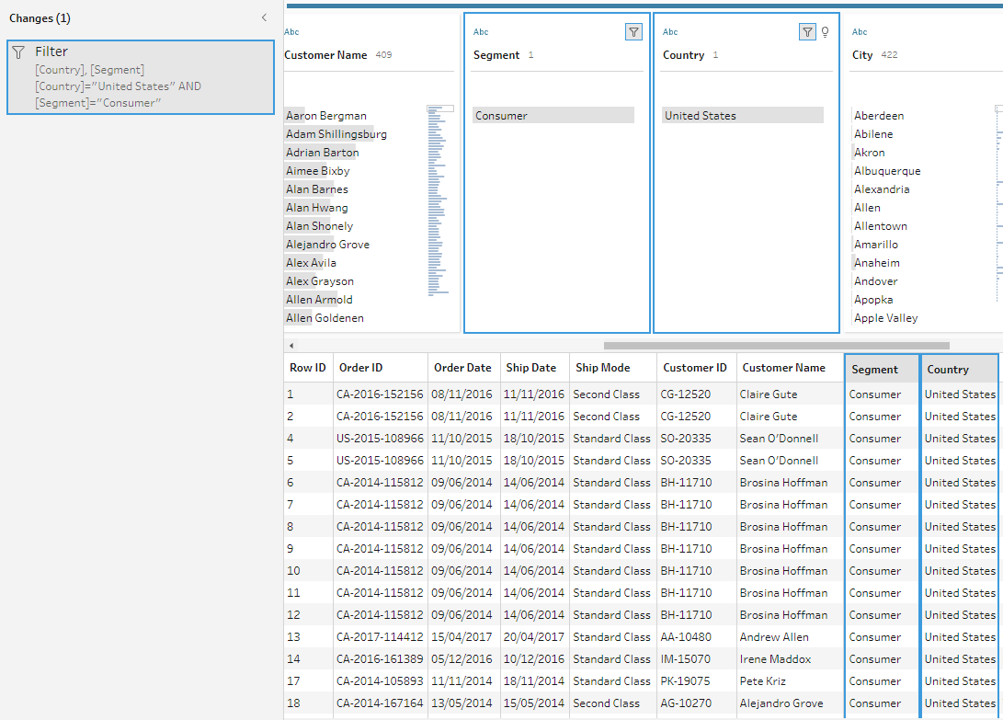
3.Filter the data
Limit the fields you import into Tableau Prep to those you’ll need for your analysis to maximise the overall effectiveness of your data preparation process.
By filtering your data, you can verify that you’re performing the proper analysis while saving time. For instance, if you need to look at sales data from the previous two years, you may use the range or relative date filters to limit the date field to that period. You might want to eliminate any incorrect or irrelevant data. A value in the data pane can be excluded with a single click. You can do this at any time during your flow.
4.Assess and tidy up the data
Tableau’s data types will have an impact on your analysis. Therefore, it’s critical to correctly identify each field before beginning. Even though Tableau allows you to update aliases, alter data types, split lots, and create calculations, it is far simpler to carry out these tasks beforehand, particularly when preparing the data set for someone else.
Tableau Prep includes built-in capabilities to aggregate and replace recurring characters or pronunciation, saving you from having to edit each one individually so that you don’t have to; these solutions use algorithms to make cleaning easier. Or, if you foresee a missing value, you may manually add it so that it will be included when the flow processes the complete data set. You can apply a computation if you know that a field must be cleaned or filtered, but it takes more than the user interface offers.

5.Understand the data results
Deciding about the final data set’s appearance while you begin to prepare your data can be difficult. For Tableau to effectively analyse your data, you might need to merge numerous data sources or pivot your data from columns to rows.

One technique to get beyond this obstacle is visualising the data pane in Tableau Desktop as to how it should appear. Do you have columns with the same value in several places? Should each product be in a single field with the sales transactions stated below, or should each product have its column with the sales transactions listed underneath? The latter is more likely, and a pivot is necessary for this situation.
You will be joining the data if you need to combine two tables. By using a join, you can increase the number of fields in your data source that you can investigate. Although a join can be added at any point during the data preparation process, the sooner you use it, the sooner you will comprehend the data set and identify areas that require immediate attention.

Like appending two data sets together, a union enables you to do so. For instance, you might have an Excel file where each sheet displays transactions from different years. You may maintain the same structure with extra rows by using a union rather than joining the tables.
After your data has been organised, processed, and filtered, it’s time to interpret what it is trying to tell you. Tableau Prep connects with your entire business intelligence platform like many other data preparation products. To allow others to begin their analysis, publish the extract to Tableau Server or Tableau Cloud. Bring it into Tableau Desktop to start posing and investigating more in-depth queries. The hardest part of the data analysis process is now complete. It’s time to share the breakthroughs that resulted from your hard work.