Tableau filters allow their users to perform simple filtering using available metrics, as well as perform advanced filtering using complex calculations. While developing dashboards, Tableau offers the flexibility to view different types of filters such as drop-down filters, wildcard filters, list filters and many more. To enhance dashboard interactivity, Tableau has provided “Filter Actions” which allow users to filter an entire dashboard as per the value selected by the user in a particular visualization.
To create a filter that suits the user’s requirements, Tableau engages several filtering techniques which also enhance data processing efficiency Each filter is designed for a specific function, and the order in which they are run can significantly impact performance.
6 Types of Filters in Tableau
Tableau employs six different types of filters, which are listed in the sequence of execution:
- Extract Filters
- Data Source Filters
- Context Filters
- Dimension Filters
- Measure Filters
- Table Calculation Filters
1. Extract Filters
Extract filters are utilised during the initial stage of data filtering. When datasets are uploaded to Tableau, we can utilise the extract filter to minimize the number of Tableau queries for the data source. By applying filters to the extract, we can further decrease the size of the data.
2. Data Source Filters
Data Source filters sort out any crucial or sensitive information while putting data into Tableau. It is compatible with both the Live and Extract connections.
We can add the data source filter to any column by selecting the ADD option. After selecting the ADD option, the ADD Filter dialogue box will appear, displaying all the fields. We can then select the field to which we wish to apply the filter and it is possible to change or delete data source filters as needed.
3. Context Filters
A context filter is generally used when we require this filter to be applied before any other filter. It has the potential to enhance the performance of massive data sources. They are made by dragging the dimension to the filter section box and selecting the Add to context option. This will make the dimension pill change its colour to “Grey”, indicating it is a context filter. Similarly, by clicking “Remove from Context”, the filter becomes a simple dimension filter. A common use case for this filter would be when a user would like to find the top N products in any category.
4. Dimension Filters
Dimension fields include discrete categorical data, and we can remove or add the values we want to investigate. The process is simple as outlined below:
Step 1: Drag the dimensions from the dimension list to the filter section box.
Step 2: From the Filter Dialog box, select the values that we want to analyze.
The Filter dialogue box contains four tabs:
- General: To select the members present in the dimension to either include or exclude
- Wildcard: To filter the result based on a particular pattern
- Condition: To filter the result based on a particular condition
- Top: To filter the Top N products belonging to a particular category.
5. Measure Filters
Measure filters are applied to the measure fields, which have quantitative data. It can be used as follows:
- Drag the measured field from the Measure box to the Filter area
- Filter dialogue box with several functions will appear.
- Select the operation that needs to be performed and click Next.
In the subsequent dialog box, there are 4 types of filters:
- Range: To select the range of values to include in the result.
- At least: Select the minimum value of a measure to filter the data.
- At most: To select the maximum value of a measure to filter the data.
- Special: To select null or non-null values.
6. Table Calculation Filter
Table Calculation Filters, being the last type of filters to be executed in the sequence of execution, do not filter out the underlying data. It is mostly used to filter out contents in the current view. Table Calculations are functions that are utilised for building Calculated Fields like LOOKUP, WINDOW SUM, WINDOW AVG, and so on.
Summing Up
Tableau Filters are the most commonly used feature by many organizations. It allows the clients to filter out confidential data and allows them to provide controlled view access to different internal users so that only data relevant to the user is accessed. Filtering out data means data processing becomes more efficient, which in turn makes the report generation process faster which in turn helps the organization arrive at quick and insightful business decisions.
Use Cases Addendum
Let’s find out how Tableau filters work to solve various tasks :
Use Case 1:
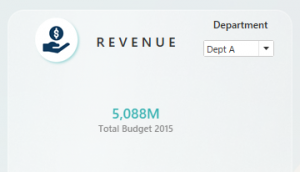

A simple drop-down filter can be used to filter the view of our requirements as shown in the visualization above.
In this example, Dept A has been selected such that the Total Budget is shown only for Dept A. Once we select Dept B, the Total Budget shows the respective value for Dept B
Use Case 2:

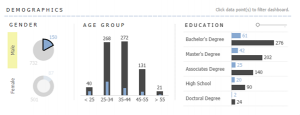
In the visualizations above, we can see the customer demographics related to gender, age group and educational status. With the help of Tableau’s Filter Actions, one can click on a particular segment and filter the rest of the visualizations as per the requirement.
For example, if we require to find how many customers in the age group of 35-44 are males, all we have to do is to click on the doughnut chart for “Male”, and the visualizations will show only the data for males. Now, we can find that the number of male customers in the age group of 35-44 is 272.
Use Case 3:
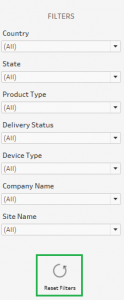
The Filter Action feature in Tableau can be leveraged to develop several creative solutions for customers. One such solution is the “Reset Filter” as shown in the above visualization.
With a combination of filters and filter actions, one can develop a reset filter that, on clicking, would reset all the currently applied filters on the dashboard and bring it back to its original unfiltered view. This comes in handy if the dashboard consists of multiple visualizations and contains heavy data.